Live now
Boston moves on the T
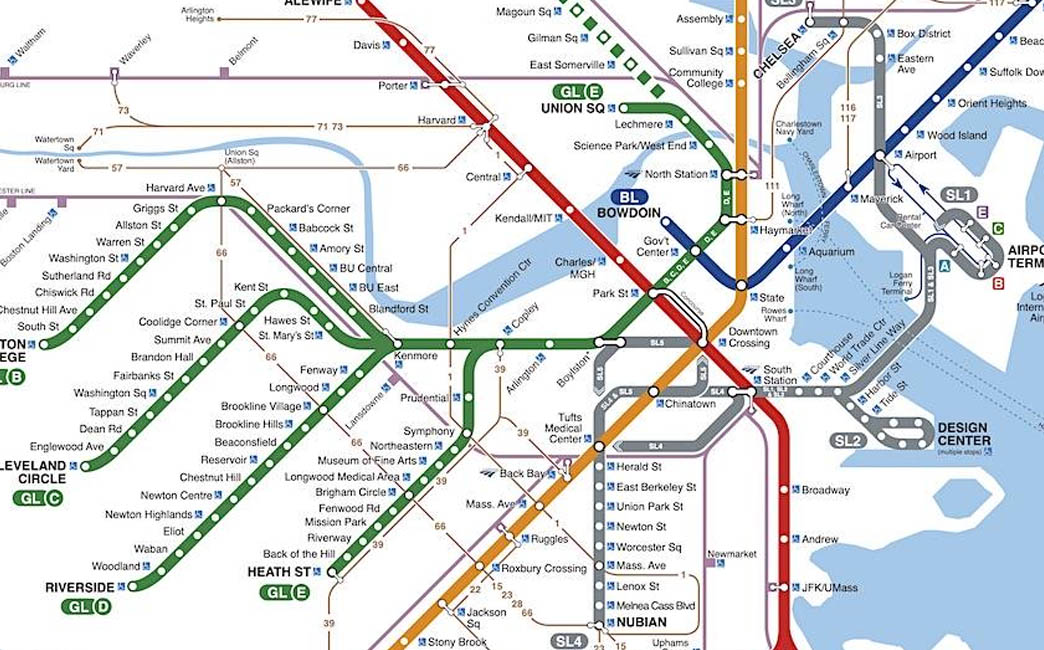
Each dot is a train on the Red, Orange, Blue or Green Line, a Mattapan trolley, or a Silver Line bus, placed from the MBTA’s real-time feed. Dozens are running right now.
A linear regression model to analyse socio-demographic variables across TOD and non-TOD tracts.
In this project, I had the opportunity to explore Boston’s rapid transit system, known as the “T,” as a vital component of the city’s public transportation network. Using machine learning models and optimizing accuracy and minimizing errors, I used data analysis to make policy recommendations and aswer questions like do households value transit-rich neighborhoods compared to others? How certain can planners be about data-driven conclusions given some spatial biases?
This policy brief attempts to address the value and citzen settlement patterns of transit-rich neighborhoods, comparing them to the city at large. It makes extensive use of the American Community Survey data, along with publically available information on the MBTA’s rapid transit routes and stops.
Scroll through the analysis on a map, starting with every T train running right now.
Live now
Each dot is a train on the Red, Orange, Blue or Green Line, a Mattapan trolley, or a Silver Line bus, placed from the MBTA’s real-time feed. Dozens are running right now.
Walksheds
Planners treat half a mile, about a ten-minute walk, as a station’s reach. These are the half-mile walksheds around the 121 rapid transit stops in Suffolk County, which takes in Boston, Chelsea, Revere and Winthrop.
Transit-rich tracts
A census tract counts as transit-oriented when its center falls inside a walkshed: 136 of the county’s 234 tracts in 2020.
Rent
In 2020, median rent in transit-rich tracts averaged $1,695, against $1,457 in the rest of the county. Rents rose everywhere after 2016, and the premium for living near transit grew.
*2016 values in 2020 dollars.
Income
Median household income in transit-rich tracts rose from $68,658 to $82,324 in 2020 dollars, and the gap with the rest of the county widened.
*2016 values in 2020 dollars.
Rent burden
Households that spend more than 30% of their income on rent are rent-burdened. The typical share in transit-rich tracts fell from 31.4% to 30.4% while it edged up elsewhere. Rents rose too, so the likelier story is higher-income households moving in, not housing getting cheaper.
What it means
Transit-rich neighborhoods are where Boston’s housing demand concentrates. Keeping homes near the T within reach of the people who rely on it most is where transit-oriented development has to work hardest.
Recomputed for this page with the original method: ACS 5-year estimates (2012–2016 and 2016–2020) for Suffolk County tracts, MBTA rapid transit and Silver Line stops, and tracts whose center lies within half a mile of a stop. Vehicles: MBTA V3 API.
Click the full analysis button at the top to view at full screen.